Data is a communication tool.
In web services, it's common practice to regularly extract and analyze logs accumulated in Google Analytics, BigQuery, and other data aggregation tools. Product managers in particular are expected to process this data and use it as a communication tool — in the right proportion at the right time. But the cost of sharing data with a team and making it visible every day remains surprisingly high.
Collecting logs from Google Analytics or BigQuery, processing them, creating charts, and then posting those charts to Slack — the team's communication hub — is something I do routinely. But:
- I want to observe the same metrics daily
- Running the same SQL queries manually every time is a hassle
- The data lives in multiple places
...these factors make it very costly.
So I built a system using GSheet + Google Apps Script that handles aggregation, analysis, chart creation, and Slack sharing in one uninterrupted automated flow. And of course: serverless, and free.
Prerequisites
- Get access to Google Analytics or BigQuery from your admin
- Look up the Slack token for the Slack team you want to post to — it should be a string starting with
xoxo-… - (Optional) Learn the basics of JavaScript syntax
Flow overview
The process runs as follows:
- Update numbers from BigQuery (or Google Analytics) into GSheet
- Create charts on GSheet to extract any insights you want
- Post the charts to a specific Slack channel
- Bundle steps 1–3 and set a trigger to run on a schedule
Steps 1, 3, and 4 are automated using Google Apps Script.
Step 1 / Update numbers from BigQuery (or Google Analytics) into GSheet
For example, if you're running the same daily query in BigQuery for basic metrics like DAU, Retention Rate, and Frequency, you can automate it using the following Google Apps Script (many thanks to Toreta for this approach):
Making BigQuery charts easily with Google Apps Script : TORETA Blog
The details are in the article, but in just two steps you can automate data updates from BigQuery to GSheet.
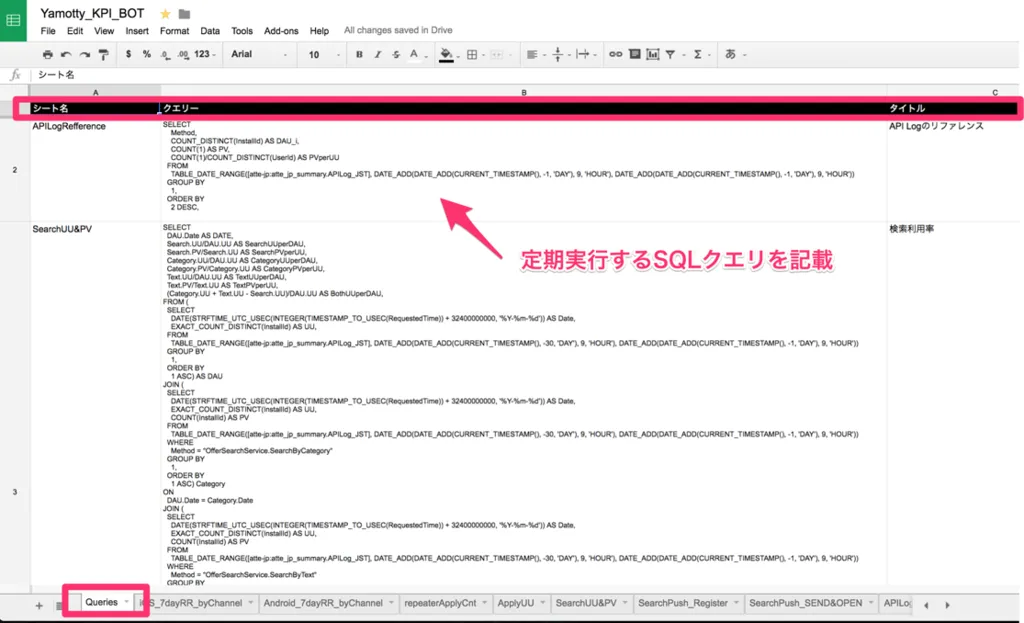
Set up a GSheet based on the article: create a sheet called "Queries" and fill in the sheet name, query, and title.
Create the Google Apps Script.
- Google Spreadsheet → BigQuery script · GitHub
- Look up the BigQuery projectId
- Enable BigQuery API in both GAS and GCP
Step 2 / Create charts on GSheet to extract insights
When you run runAllQueries in GAS, all SQL queries written in the sheet execute and the results update each sheet. Use this data to create charts once — after that, every time the data updates, the charts update automatically. Margins, colors, data labels, and everything else you set up initially will carry over, so take the time upfront to make them look right.
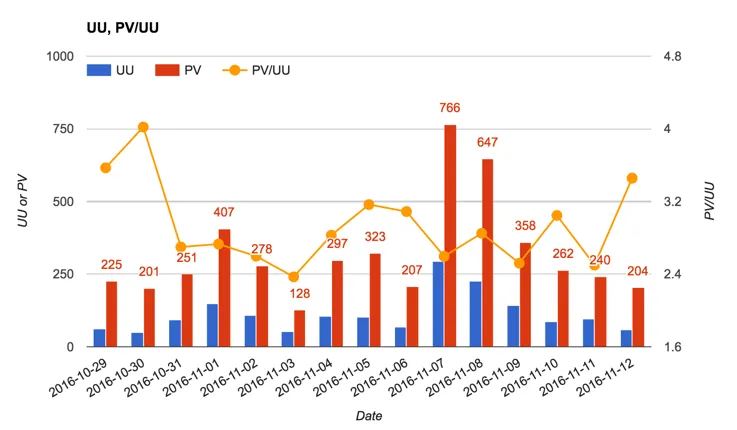
Personally, I prefer charts that convey a lot of information at once — multi-axis charts, bubble charts, and Mondrian charts all work well.
Step 3 / Post charts to a specific Slack channel
Post GAS-generated charts to Slack - Qiita
I built this step based on this article. It breaks into two sub-steps: "convert chart to image" and "post image to Slack."
I had actually given up on the "convert to image" part for quite a while — but it turned out to be trivially easy using getCharts, which is built into the Sheet class of Google Apps Script. Here's sample code for fetching two charts and sending them to Slack:
var slack = {
postUrl : 'https://slack.com/api/files.upload',
token : "xoxp-hogehoge",// Slack token
channelId : "blog" // Slack channel name to post to
}
var uploadFile = function(data){
UrlFetchApp.fetch(slack["postUrl"], {
"method" : "post",
"payload" : {
token: slack["token"],
file: data,
channels: slack["channelId"]
}
});
}
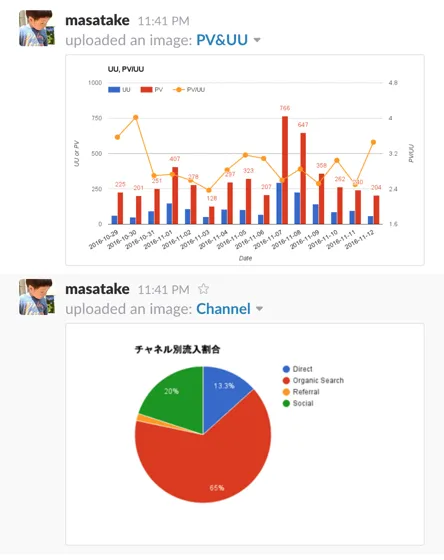
/* 1. Post UU & PV */
function postSlack_PVperUU() {
var sheet = SpreadsheetApp.openById("hoge").getSheetByName("test");
var chart = sheet.getCharts()[0];
uploadFile(chart.getAs("image/png").setName("PV&UU.png"));
}
/* 2. Post UU by channel */
function postSlack_Channel() {
var sheet = SpreadsheetApp.openById("hoge").getSheetByName("Channel");
var chart = sheet.getCharts()[0];
uploadFile(chart.getAs("image/png").setName("Channel.png"));
}
Notes
openByIdtakes the GSheet ID as its argument. You can find it in the GSheet URL.getSheetByNametakes the sheet name, as the name suggests.getAsspecifies the image format;setNamesets the image filename.
Bundle steps 1–3 so everything runs end-to-end. In the example below, a function called doAll runs everything at once:
/* Execute all GSheet queries and post all charts to Slack */
function doAll(){
  runAllQueries(),
  postSlack_PVperUU(),
  postSlack_Channel()
}
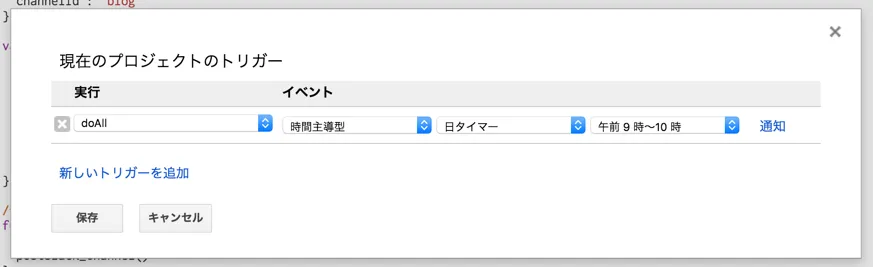
Then go to Resources > Current Project's Triggers in Google Apps Script and set doAll to run automatically at a fixed time every day. Automation complete.
Set it to run just before you get to work, and you can review everything on your phone before you even sit down — a significant productivity boost.
In closing
The really powerful thing about this entire setup is that if it can connect to GSheet, any chart can be visualized in Slack.
I consolidate all messages between my wife and me into Slack as well. If IoT services (which are becoming more popular) can connect to GSheet, you could automate experiences like these:
- Check your daily sleep hours in Slack and trigger a "go to sleep" alert when you fall short
- Check your step count in Slack and trigger an "exercise more" alert when you're inactive
- Check household budget projections in Slack to decide when to cut back or splurge
Those aren't the best examples, but feel free to let me know if you have better ways to hack this kind of setup.


Comments
Share your thoughts or questions. Comments are published after approval.
Write a comment