Instacart, the same-day grocery delivery service founded in 2012, has filed for an IPO.
Instacart is drawing widespread attention from investors in a cooling US stock market, and for good reason — it's a notable company on multiple fronts:
- The largest startup in the online grocery industry
- Famous for explosive COVID-era growth, with close scrutiny of what came after
- One of the last major representatives of the 2010s sharing economy wave alongside Uber and Airbnb
As Bloomberg reported, the company faced steep valuation cuts after the COVID tailwind faded — but has now achieved IPO status. Congratulations to everyone involved.
Founded in 2012, Instacart has been considering going public for several years. According to Pitchbook, the company raised $2.74 billion as a private company and was valued at $39 billion in 2021.
How I'm Reading the S-1
10X, the company I run, operates in the same broad market as Instacart — online grocery — so the company has been on my radar since before we founded 10X. The IPO filing's Instacart S-1 made the company's full picture public for the first time, and we read through it carefully and discussed it internally. Here are those rough notes, made public.
Market Leadership That's Hard to Contest
The cover page leads with business highlights. Two things stand out immediately:
- $29.4B in GTV (gross transaction value) — an enormous number
- 80,000 partner stores, representing 85% of grocery market share
And the logos include Kroger — and even Walmart, a former adversary. 85% of the market means they've captured everyone from mom-and-pop shops to local brands to global names. That's what 85% represents.
A quick analysis of the stats disclosed in the S-1:
- Average daily orders per store: 9.2 orders/day
- Average daily revenue per store: $1,012/day
This reframes things a bit.
For a given store, using Instacart generates roughly 9 additional orders per day and about ¥150,000 in additional revenue. But stores typically handle hundreds to tens of thousands of in-store transactions daily — 9 orders is honestly not a big number. And if a retailer tried to run same-day delivery in-house with its own people, vehicles, and systems, 9 orders per day would never cover costs.
What these stats reveal: Instacart's real value proposition for retailers is "a modest but effort-free incremental revenue stream." Not transformational, but frictionless.
A Top-Heavy Structure
Looking at Instacart's top sellers reveals a picture that's the inverse of that "average":
43% of the $29B in GTV — $12.4B, about ¥1.7 trillion — comes from just three retailers. That's roughly ¥600B per retailer per year.
Further, the top 20 partners account for 5% of each partner's sales via Instacart (up from 0.6% in 2018), making it an "undropable revenue source" for top partners.
This suggests a hypothesis: among the 80,000 stores on Instacart, many may be generating fewer than the average 9 orders per day — possibly even zero.
For example, Kroger, likely near the top 3, has about 2,800 stores. If we assume they generate 1/3 of the $12.4B top-3 figure — roughly $4.1B/year — that works out to about 37 orders per store per day, roughly 4x the average. Well above the average. This is an estimate.
So while some retailers generate massive volume, my hypothesis is that many stores on the platform may receive zero orders on a given day.
Explosive GTV Growth
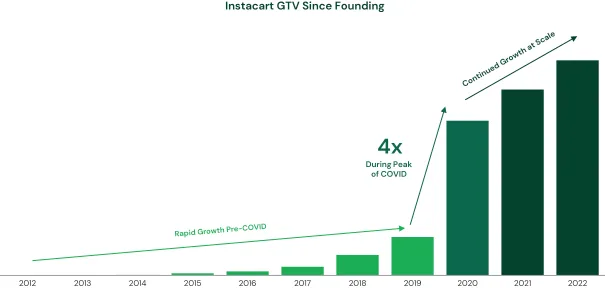
From founding in 2012 to 2017, Instacart took roughly five years to reach $1B in GTV. COVID accelerated everything, and by 2022 they'd reached approximately $29B.
Right timing, right place — the rapid growth itself became a moat. The traffic and network they have was largely built in the three-year span post-COVID, and no amount of product features or engineering could allow a competitor to replicate it today — it would require another COVID-scale event.
The S-1 itself acknowledges the risk of this in the risk factor section. The growth was COVID-driven and may not be sustained:
(Summary) GTV: $5.1B in 2019 → $28.8B in 2022 (CAGR +78%). Revenue: $214M in 2019 → $2.55B in 2022 (CAGR +128%). Growth rates were heavily influenced by COVID-19 demand and may continue to decline.
Basket Economics Generating 6.4% Gross Margin
The S-1 discloses basket economics in notable detail — impressive transparency, though I imagine disclosing unit economics this clearly at this level of detail is a difficult requirement.
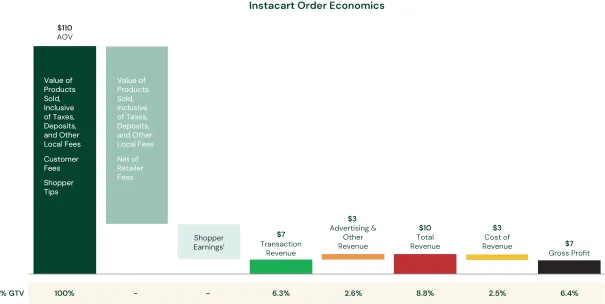
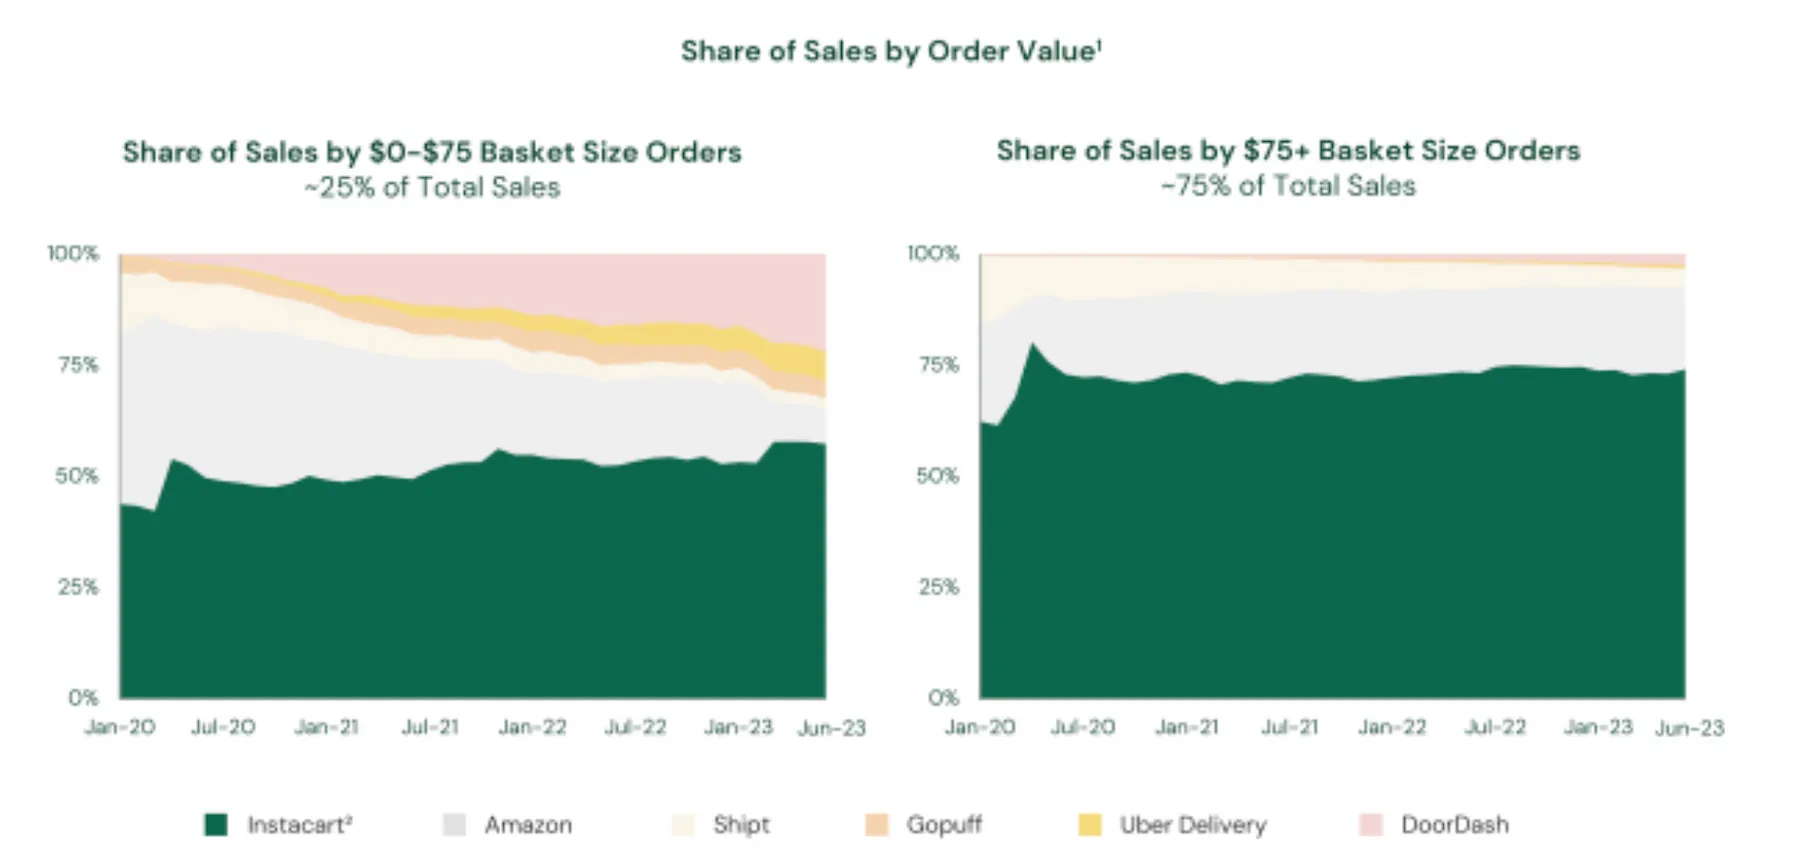
AOV (average order value) is $110 — an exceptionally high level compared to Uber Eats, DoorDash, and quick commerce players (this is documented in another chart in the S-1).
Instacart earns $10 per basket, of which $3 comes from "Other" (Instacart Ads and subscriptions). Cost of Revenue is approximately $3 (mainly payment fees), leaving $7 per basket — about 6.4% of GTV — as gross margin.
The three components of Instacart's value proposition to retailers:
- Providing on-demand people and vehicle operations that retailers can't provision themselves
- Customer acquisition (approximately 2.4% of GTV is invested in this)
- Matching retailers with customers and providing the shopping environment
Looking at other data, Instacart is reinvesting over 2% of GTV in promotions to keep valuable customers on the platform. My interpretation: the actual platform take rate is about 4% of GTV, net of that customer retention investment.
Notes on the Economics
The high proportion of "Other" revenue (Instacart Ads, Instacart+) stands out. These are pure revenue streams that don't need to be shared with retailers. These "clean" revenue streams covering Cost of Revenue are a major reason the basket-level economics are profitable.
The second thing that stands out is the high but stable AOV. Let me deliberately read "stable" as "stuck."
Instacart is known in tech circles for excellence in search, recommendation, and ML model development — the Instacart Tech Blog documents this extensively, and there's a famous Kaggle competition using Instacart data.
Yet despite years of tech investment, the data shows that AOV hasn't moved much:
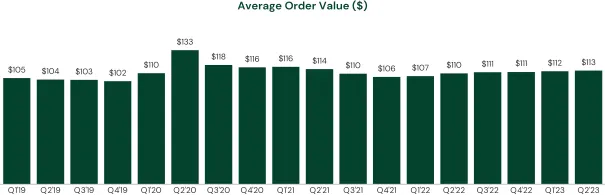
You'd intuitively expect better search and recommendation to mean "users find more of what they want, so AOV rises" — but that doesn't seem to be what's happening. Our internal hypothesis at 10X is that these investments are positively impacting engagement metrics like conversion, frequency, and retention, rather than basket size directly.
Negative Churn in the GTV Cohort
Alongside basket economics, cohort analysis is among the most important data. And Instacart's cohorts show excellent stats.
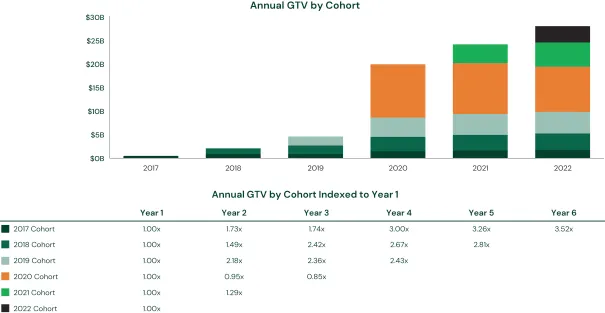
The cohort structure shows GTV cleanly stacking from past + current cohorts, with three key observations:
- The 2020 cohort shows annual churn (Y2: 95%, Y3: 85%)
- The 2020 cohort accounts for roughly 40% of 2022 total GTV
- All cohorts other than 2020 show negative churn (growth)
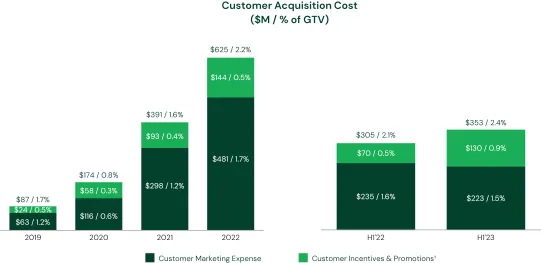
Going forward, growth requires "the speed of 2020 cohort GTV decline" to be outpaced by "new customer acquisition + growth in other cohorts." The large 2020 cohort's decline will weigh heavily for the next few years, requiring sufficient new acquisition to offset it. Hence customer acquisition costs have been trending upward: 1.7% of GTV in 2019, 2.4% in H1 2023.
Once 2020 cohort dilution is absorbed by cumulative GTV growth, the business will become less dependent on acquisition spending.
Note: a 2%+ customer acquisition cost relative to GTV is high by brick-and-mortar retail standards. Traditional supermarkets use flyers as their primary acquisition tool, typically spending around 1% of revenue.
Enterprise Platform Business
Finally, Instacart has also been building an enterprise platform business — similar in nature to what 10X does with Stailer. The key distinction from the Marketplace model is that these are partner-branded storefronts powered by Instacart rather than branded as Instacart.
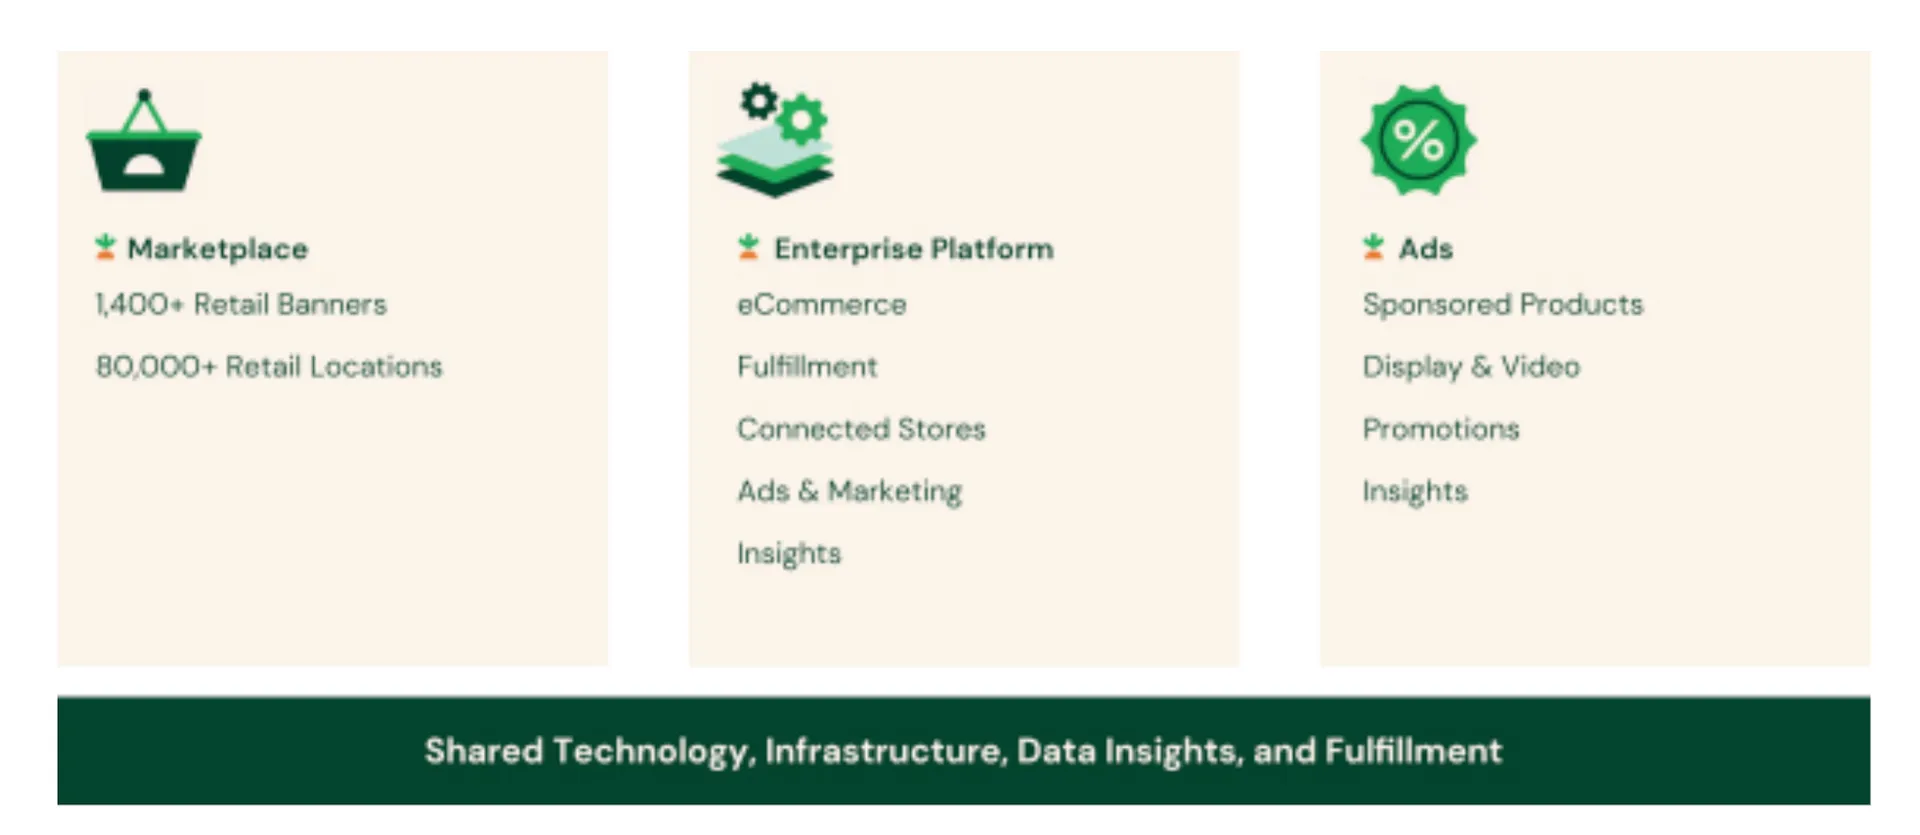
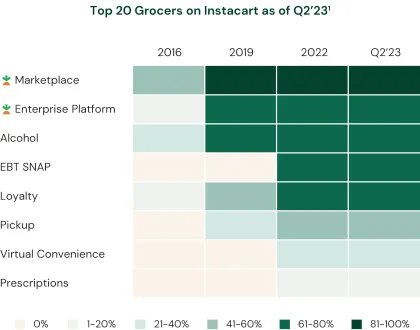
61–80% of top-20 retailers use both the Marketplace and the enterprise platform in combination.
The interpretation: the two models serve different value propositions:
- Effortless incremental revenue without the retailer lifting a finger: Marketplace
- Building a brand-controlled, customer-direct e-commerce experience: Enterprise Platform
These are complementary enough that top retailers use both.
What About a Marketplace Model in Japan?
Japan has seen multiple attempts at Instacart-style gig-worker marketplace models — led mostly by foreign entrants — and essentially all of them have exited. (Example: honestbee.)
Contributing factors: Japan already has over 20,000 supermarkets in dense concentration, and the gig economy model is difficult to operate within Japan's employment practices.
Given this context, 10X's Stailer business has chosen to center on a platform model — serving as an infrastructure layer for partners and the online grocery market rather than operating as a marketplace. (End.)


Comments
Share your thoughts or questions. Comments are published after approval.
Write a comment