In September 2023, just before Instacart's IPO, I read through the S-1 and laid out six hypotheses (original post here).
Two and a half years have passed since then, and the landscape around the tech industry has shifted considerably.
Having followed Instacart's post-IPO disclosures, earnings reports, and press releases, I want to go back and verify those hypotheses — which ones were right, which ones were wrong.
Key Metrics: 2022 vs. 2025
First, let's establish where things stand today.
| Metric | At S-1 (2022 Actuals) | 2025 Actuals |
|---|---|---|
| GTV (Gross Transaction Value) | $28.8B | $37.2B (+29%) |
| Revenue | $2.55B | $3.74B (+47%) |
| GAAP Net Income | $428M (primarily tax effects) | $447M |
| Adj. EBITDA | — | $1,087M (29% margin) |
| Advertising Revenue | $740M (2.6% of GTV) | $1,065M (2.9% of GTV) |
| AOV (Average Order Value) | $110 | ~$110 (flat) |
| Order Count | ~260M | 338.8M (+30%) |
| Retail Locations | 80,000 | ~100,000 |
| Active Users | — | 14.9M (slight increase) |
The numbers alone tell a story of growth — but the valuation trajectory tells a different one.
- 2021: Private round valuation of $39B
- September 2023 IPO: IPO price of $30 (~$10B market cap). Shares surged to $42 on open, then fell back to the low $30s by end of day
- 2024 (one year post-IPO): Traded in the $25–30 range, hovering near or below the IPO price
- March 2026: ~$38, market cap ~$9B
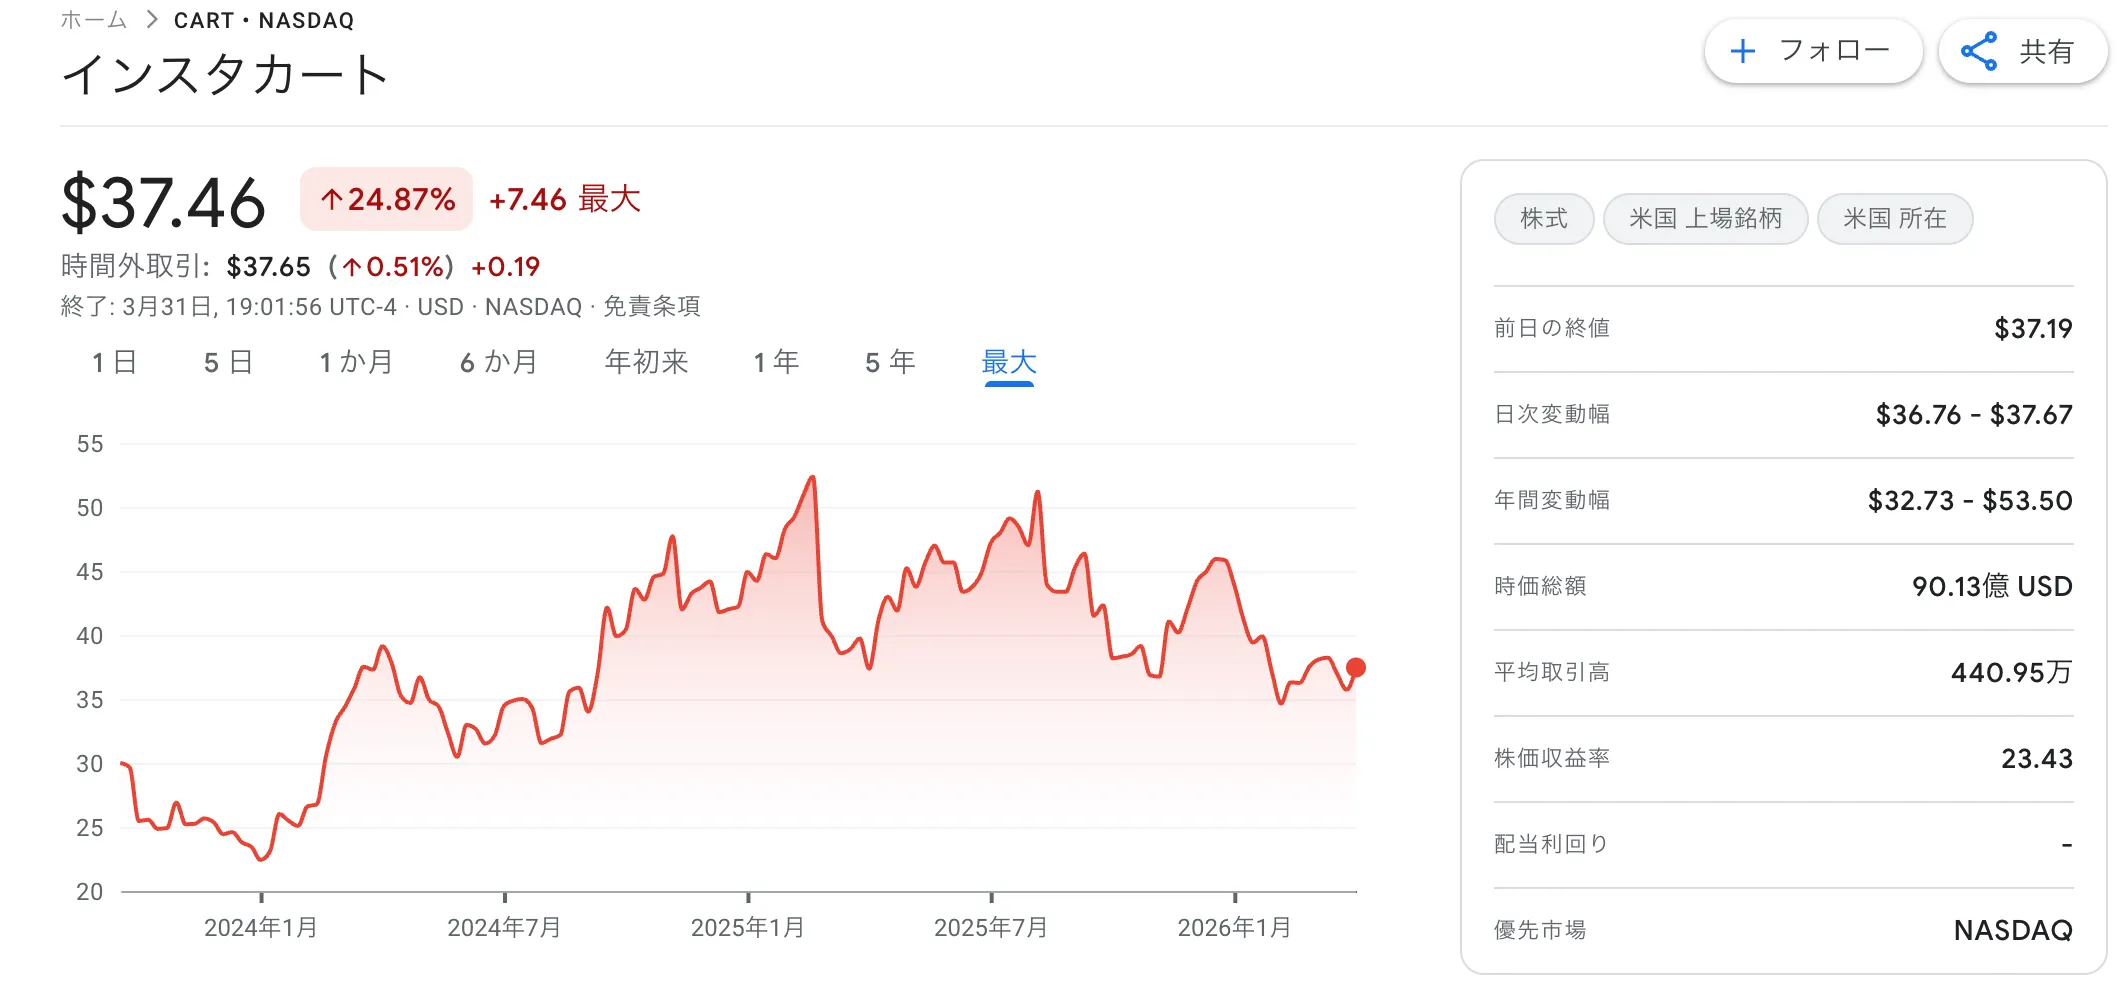
Down roughly 75% from the 2021 peak of $39B. The divergence between market valuation and operating metrics is what I want to unpack through these hypothesis reviews.
Hypothesis 1: Top-Heavy Structure — Correct
My original hypothesis: "Of those 80,000 retail locations, the majority probably receive less than one order per day."
Let's check the current numbers. Dividing 338.8M annual orders by 100,000 locations gives roughly 3,388 orders per location per year — about 9 per day on average.
Even as the location count grew from 80,000 to 100,000, order density per location barely changed. The math would have shown something similar back at the S-1 filing, and that structure didn't change even after Instacart ended its Kroger exclusivity and opened up to DoorDash and Uber Eats.
The assumption that long-tail locations would be used lightly and broadly — a top-heavy structure — has held up even as the numbers changed.
Hypothesis 2: COVID Was the Moat — Correct
My view after the IPO was that the explosive GTV growth driven by COVID couldn't be replicated.
Looking at the actual numbers: GTV grew from $28.8B to $37.2B, a 29% increase — not a high-growth range by any measure. Market share declined from roughly 70% to roughly 58%, and market cap dropped about 77% from $39B to $9B.
The private valuation had presumably priced in aggressive growth. What followed instead was multiple compression as growth matured and stabilized — a pattern consistent with the interpretation that "COVID-era hypergrowth was discounted."
Hypothesis 3: AOV Won't Rise Even With Technology Investment — Correct
My hypothesis: "Even with better search and recommendation, AOV is structurally hard to increase."
AOV is still flat at $110, three years later.
In that time, Instacart rolled out Smart Shop (generative AI recommendations), ChatGPT integration, and Agentic AI for Kroger — a relentless pace of AI launches. Order count grew from 260M to 338.8M (+30%), but AOV didn't move.
To be fair, it's not clear that these AI features were primarily aimed at raising AOV. Improving retention or advertising efficiency may have been the real goal. Still, the question of whether technology investment could expand basket size has been answered (though these technologies may well have contributed to higher order frequency).
Grocery shopping AOV is determined by what you need to buy that week. UI improvements and recommendation precision can't easily move it. That structural understanding turned out to be right.
Hypothesis 4: Advertising Is the Key to Profitability — Correct
My hypothesis: "If $3 in ad revenue per basket compounds at high margins, profitability becomes achievable." This was the hypothesis I held with the most conviction.
Advertising revenue grew from $740M to $1,065M (+44%), and its share of GTV ticked up from 2.6% to 2.9%. In 2022, profits had been driven by a one-time tax effect. By 2025, GAAP net income of $447M and Adj. EBITDA of $1,087M (29% margin) reflect genuine underlying earnings power.
Instacart has effectively completed its evolution into a "grocery e-commerce advertising network."
Even if delivery economics are thin, CPG companies will pay a premium for ads tied directly to purchase data. That was the structural insight I believed was at the heart of what Instacart was really building — and that read turned out to be largely correct.
Hypothesis 5: The 2020 Cohort Problem — Unverifiable (Disclosure Discontinued)
My concern: if the cohort of users acquired during COVID in 2020 showed high churn, it would become a structural growth ceiling.
After going public, Instacart discontinued cohort disclosures. Unfortunately, I can't verify this one.
That said, the fact that active users have grown only slightly to 14.9M does suggest slowing new user acquisition.
Hypothesis 6: Evolution Into an Enterprise Platform — Developed in an Unexpected Direction
My hypothesis: "Instacart will pursue a dual-track expansion similar to Stailer — combining a retailer-facing platform with a consumer-facing marketplace." (Stailer is a product by 10X, a Japanese grocery e-commerce platform company.)
The direction was right, but an unexpected axis emerged: Caper Cart. Caper Cart is an AI-powered smart shopping cart — a device with a built-in display that lets shoppers scan items as they go and check out without a traditional register. (In Japan, Trial supermarkets are rolling out a similar concept — see Trial's official post for reference.) Over the past year, deployment tripled, reaching 100 cities across 15 states.

When I read the S-1 in 2023, I was imagining a "software dual-track." What actually emerged was a third axis: hardware plus AI.
Final Scorecard and Remaining Questions
| Hypothesis | Summary | Grade |
|---|---|---|
| ① Top-Heavy Structure | ~9 orders/day per location, unchanged even after expansion | ◎ |
| ② COVID Moat | GTV +29% but market share declined, market cap down 75% | ◎ |
| ③ AOV Won't Rise | Still $110 after two and a half years of AI investment | ◎ |
| ④ Advertising as Profitability Driver | Ad revenue $1,065M, genuinely profitable | ◎ |
| ⑤ 2020 Cohort Risk | Cohort disclosure discontinued post-IPO, unverifiable | ✗ |
| ⑥ Enterprise Platform Evolution | Caper Cart emerged as an unexpected hardware axis | △ |
A pretty solid scorecard, all told.
How should we evaluate the current $9B market cap? With GAAP earnings of $447M, that works out to roughly a 20x P/E. Viewed as a grocery delivery business, it looks expensive. Viewed as an advertising platform, it looks cheap. The answer depends entirely on which frame you apply.
My own read is that Instacart will sharpen its identity as an "advertising platform" — with transactions serving primarily as the apparatus for collecting the data that powers that platform.
The evidence behind that is its investment in Caper Cart.
If smart carts achieve meaningful penetration in physical retail, Instacart would hold in-store purchase data — no delivery required. Ad CPMs would jump. If that plays out, a day may come when people look back and say the $9B market cap was "unbelievably cheap."


Comments
Share your thoughts or questions. Comments are published after approval.
Write a comment