The Takaichi administration's campaign pledge to cut the consumption tax on food from 8% to 1% is a big deal for people in food retail, and operators seem almost uniformly upbeat about it.
What everyone pictures is a bright scenario: more customers, higher sales, and shoppers trading up to higher value-added products.
I wanted to work out how large that effect actually is by leaning on examples from abroad, so this article estimates the impact of the cut using real overseas data and cases.
Premises
- Food in Japan is already taxed at the reduced rate of 8% (the standard rate is 10%), so for food the real question is a cut from 8% to 1%.
- This cut is a temporary measure. PM Takaichi has said it would start in April 2027 and revert to 8% after about two years, framing it as a "bridge." Like the overseas cases, it is not permanent.
- On a tax-inclusive basis, going from 8% to 1% means, in theory, about −6.48% of room to cut prices (1.08 → 1.01).
- In the overseas cases cited here, the tax equivalent to Japan's consumption tax is called VAT (Value Added Tax). It works much like Japan's consumption tax: an indirect tax added on top of the price of goods and services.
- As we'll see, this size of cut is among the largest of recent food VAT cuts abroad.
Where Did the Tax Cut Go, Overseas?
"Even if you cut the rate, won't shops and wholesalers just hold prices and pocket the difference?" That's a fair worry. It has been measured country by country as the pass-through rate: what share of the cut actually reached the shelf price.
In recent years a string of countries cut food VAT as an anti-inflation measure, and the research has piled up.
| Country (scope) | Before | After | Cut period (all temporary) | Pass-through | Notes |
|---|---|---|---|---|---|
| Sweden (food / preliminary) | 12% | 6% | Apr 2026 – Dec 2027 (~21 mo) | Nearly full (~100%) | Food fell 5.5% MoM in the first month; the 5.7% YoY drop is the largest in ~30 years |
| Portugal (46 essential foods) | 6% | 0% | Apr 2023 – Jan 2024 (~9 mo) | 99.8% | Full and symmetric pass-through |
| Poland (basic foods) | 5% | 0% | Feb 2022 – Mar 2024 (~26 mo) | 44–58% at first → 94.6% after 5 mo | Near-complete, with a lag |
| Spain (basic foods) | 4% | 0% | Jan 2023 – Sep 2024 (~21 mo) | ~70–100% | Nearly complete at the supermarket level (oil/pasta 10%→5%) |
| Germany (food) | 7% | 5% | Jul 2020 – Dec 2020 (6 mo) | ~80% | Asymmetric: only half passed through on the way back up |
Sources: Sweden SCB "Food prices fell in April" and CPI April 2026; Portugal Banco de Portugal WP (2025); Spain Banco de España WP 2417; Germany ifo / ITPF (2023); Poland Food Policy vol.131 (2025).
The case closest in scale to Japan is Sweden. When it halved food VAT from 12% to 6% in April 2026, food prices fell 5.5% month-on-month in the first month. Against a theoretical cut of −5.36%, that is essentially full pass-through. These are early, preliminary figures, but they show that a large, highly visible food tax cut can be passed through almost completely, and immediately.
When Portugal cut VAT on 46 essential foods from 6% to 0% in 2023, prices dropped 5.65% versus the control right after it took effect — a pass-through of 99.8%. Germany's temporary 2020 cut was passed through at about 70% across supermarkets, and around 80% for food specifically.
Poland is the interesting one: immediate pass-through was a low 44–58%, but over five months it climbed to about 95%.
A cut, "given enough time, is passed through almost entirely, delivering a benefit to consumers while contributing very little to retailers' profits." That is the common conclusion across countries.
There is also an asymmetry worth noting. In Germany, when the rate was put back up, prices rose by only half as much as they had fallen. Cuts get through; reversals don't, as easily. The benefit of a temporary measure may not come back in full when it ends.
Points to Consider When Applying This to Japan
Overseas figures don't map straight onto Japan, because the premises differ. Here are the main points that come to mind.
- The cut is large: Japan's −6.48% is among the largest abroad (−1.9% to −5.7%). The closest are Portugal and Sweden.
- Already at 8%, with tax-inclusive price tags: In Japan, shelf prices are shown tax-included, so the cut is directly visible. High visibility tends to push pass-through.
- A high Engel coefficient: 28.3% for two-or-more-person households in 2024, the highest in 43 years. The larger the food share of spending, the larger the absolute size of the relief.
- Saving propensity and a shrinking population: Freed-up money tends to flow into savings rather than spending, and food volumes are already on a downward trend due to population decline.
- Reversal and asymmetry from being temporary: Japan's cut is also a roughly two-year temporary measure, so the German-style asymmetry ("only half comes back on reversal") and a post-period demand drop could both occur.
Estimating the Effect on Households
That Engel coefficient of 28.3% means a two-or-more-person household spends roughly ¥86,000 a month on food (about ¥300,000 of consumption × 28.3%, Household Survey 2024).
Of that, the tax-exclusive base is about ¥80,000 a month, so cutting the rate from 8% to 1% lightens the burden by about ¥5,600 a month and roughly ¥67,000 a year (¥80,000 × 7% ≈ ¥5,600 a month, times twelve). This gets divided among buying more food, trading up to better items, or simply saving.
Volumes Don't Rise Much: An Inconvenient Truth
Switching to the operators' point of view, the effect at the center of their hopes — more customers, more items per basket — may be weaker than expected.
A study that analyzed Germany's temporary cut with scanner data found the demand stimulus concentrated in durable goods, with no statistically significant stimulus for non-durables, food included.
Food is a necessity; just because it gets cheaper doesn't mean people eat twice as much.
That said, this is partly because it was "temporary." With a fixed window, the rush concentrates in stockpile-able durables and barely moves perishables. Japan's POS data from the 2014 tax hike likewise showed the rush and the payback came mainly through shopping frequency (customer count) and bulk-buying, while spend per trip stayed roughly flat year over year.
So the effect of a food tax cut is more likely to show up as a release of income than as a large jump in food volume.
The Impact on Food Retailers' Sales
The sales a retailer recognizes on its books are tax-exclusive (net).
Consumption tax is money held on behalf of the government, not the store's revenue. So if the cut is reflected straight into prices, the amount passing through the register (tax-inclusive) drops 6.5%, but that is just the shrinking of a tax deposit that was never the store's money.
A store's own net sales, as long as the pre-tax shelf price is held, move only with volume and product mix. The hoped-for "sales growth" materializes only through more customers/volume and trade-up to higher value-added products (deli items, private brands).
I estimate the change in net sales on premises grounded in the overseas cases, built so anyone can recompute it by swapping the assumptions.
- For pass-through, given the near-full (~100%) pass-through observed in Sweden and Portugal, I fix it somewhat conservatively at 90% across all scenarios.
- Multiplying the theoretical tax-inclusive cut of −6.48% by 90% gives an effective price cut of −5.8%.
- From here, the only two variables I move are the price elasticity of food and mix improvement (trade-up to higher value-added / private brands).
Volume effect      = effective price cut (−5.8%) × price elasticity of food
Change in net sales = volume effect + mix improvement
| Estimation step | Bear | Base | Bull |
|---|---|---|---|
| Price elasticity of food [variable] | −0.3 | −0.4 | −0.5 |
| Volume effect (−5.8% × elasticity) | +1.7% | +2.3% | +2.9% |
| Mix improvement [variable] | +0.0% | +0.5% | +1.5% |
| Change in net sales (volume + mix) | +1.7% | +2.8% | +4.4% |
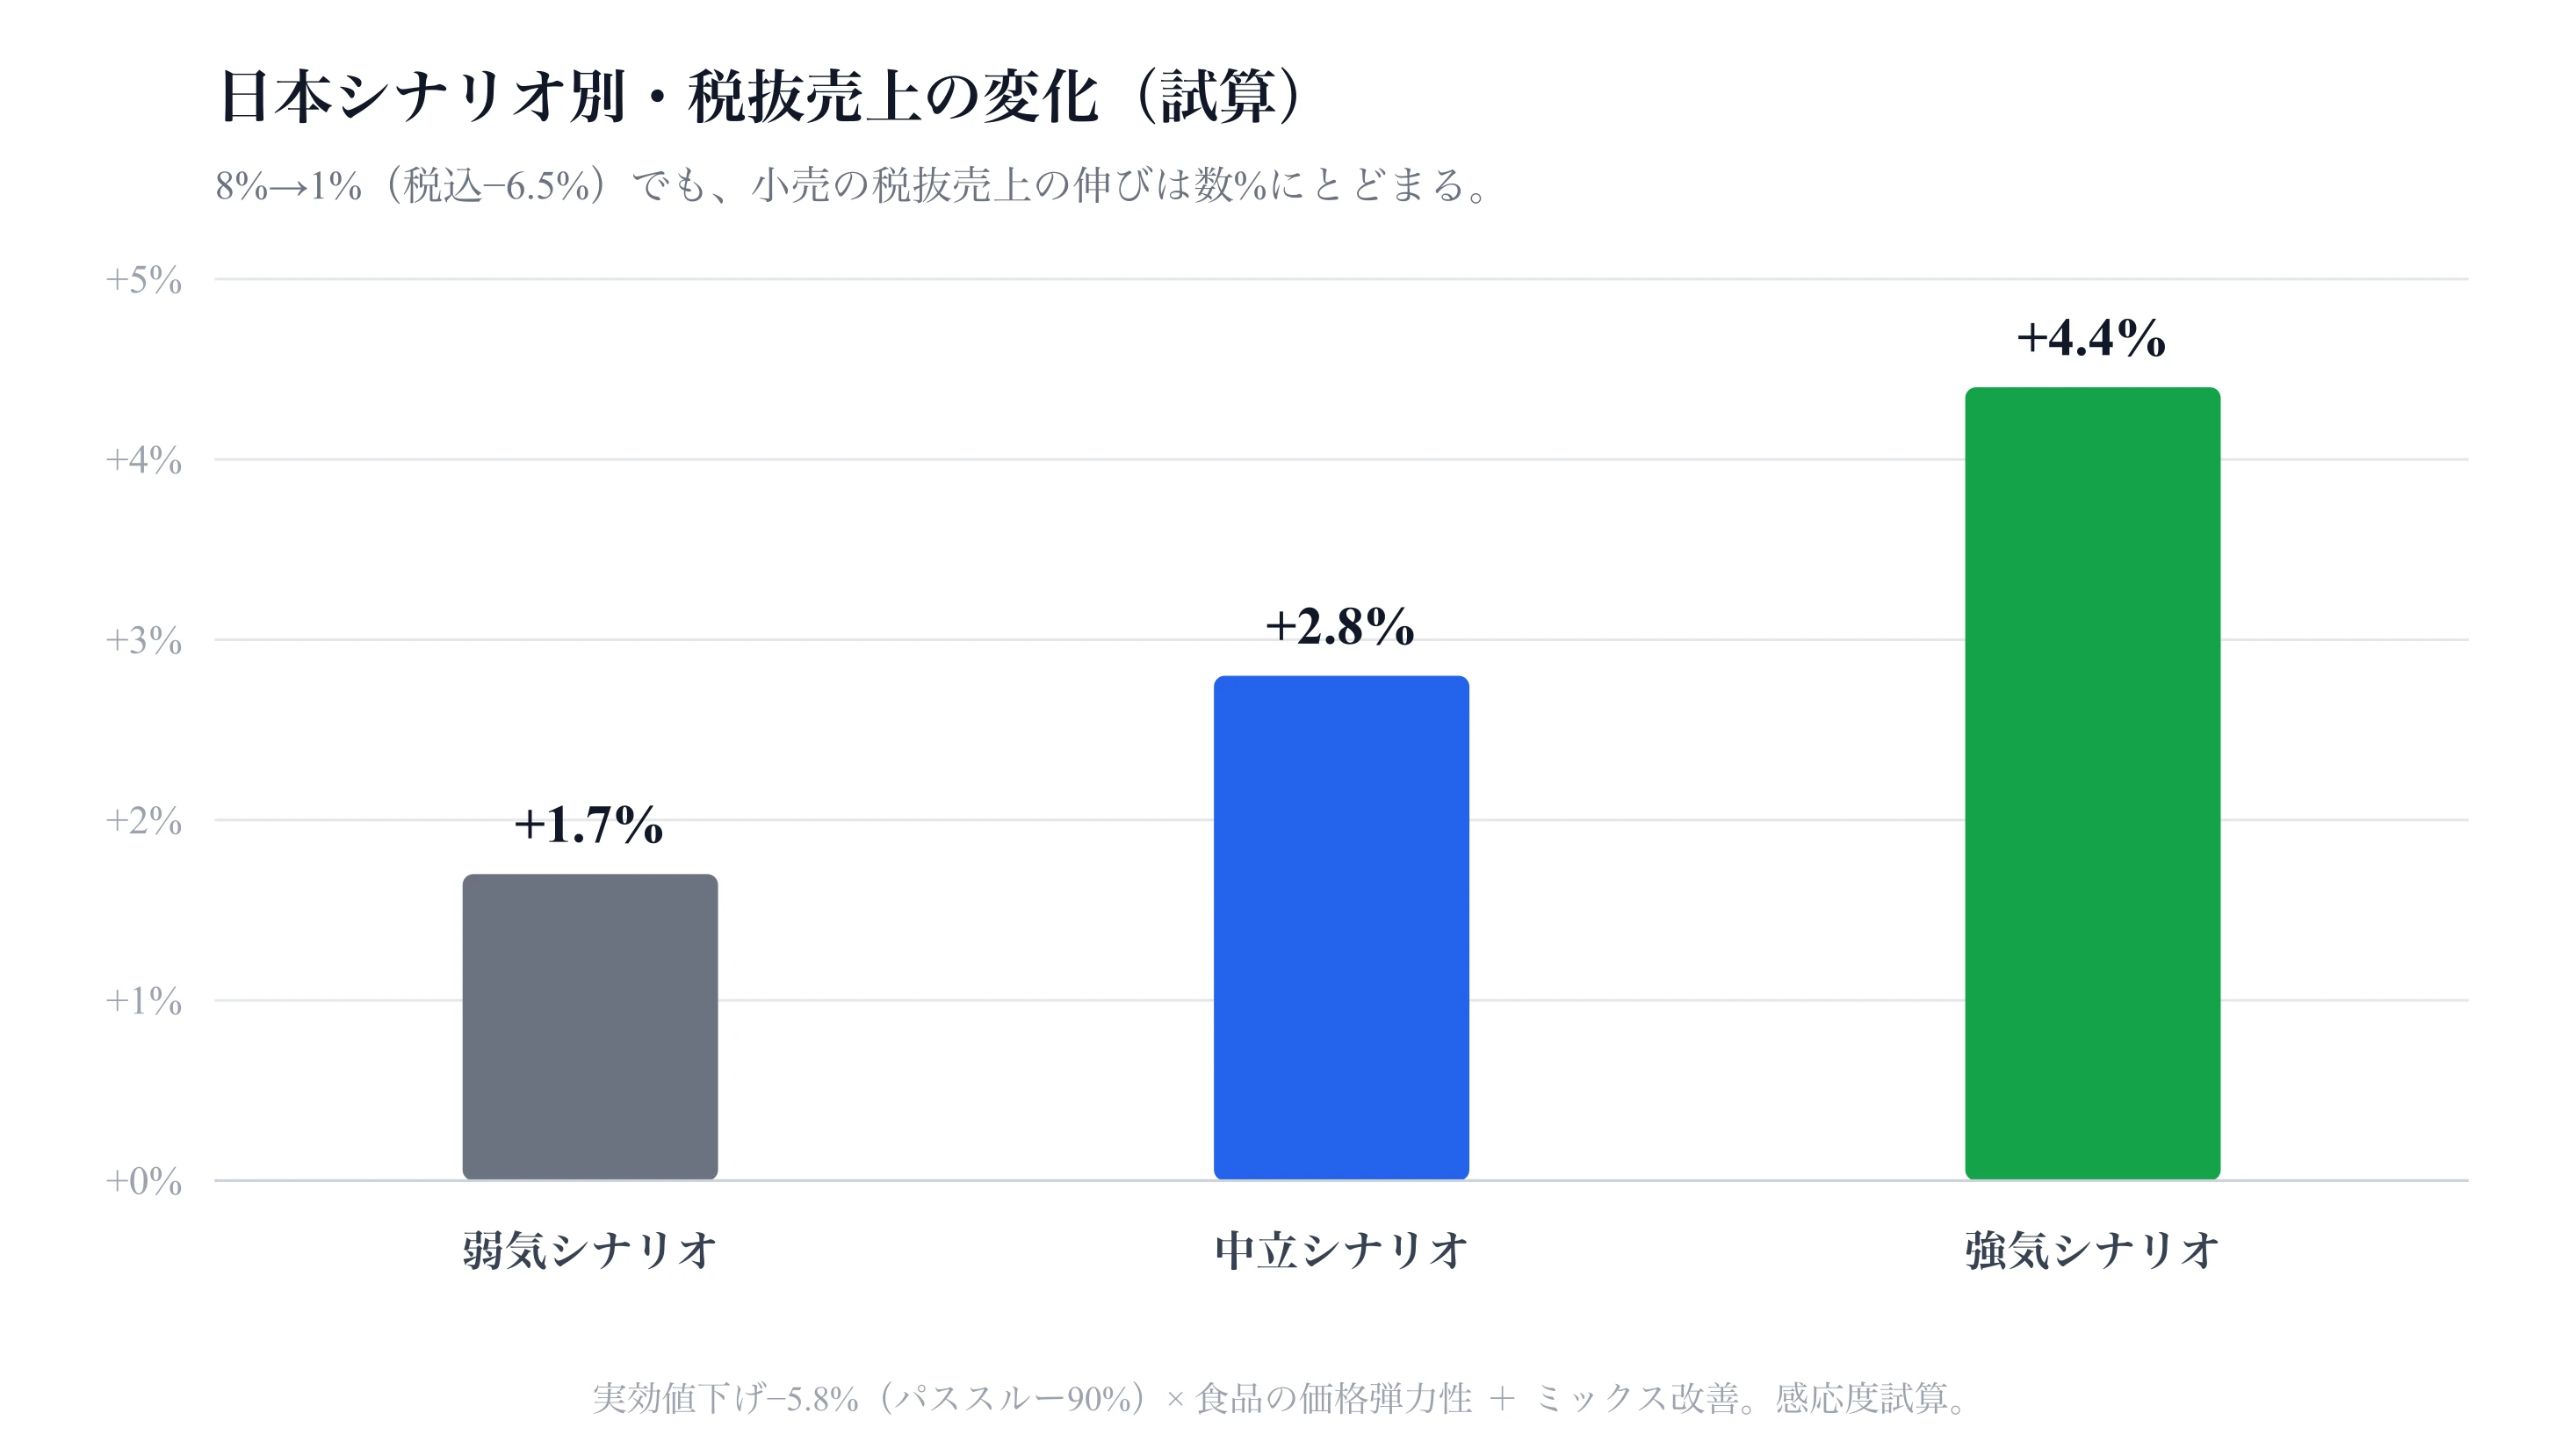
An estimate computed as effective cut −5.8% (90% pass-through) × price elasticity of food + mix improvement.
Even in the base case, net sales rise just +2.8%. That's not the dramatic number people expect.
The Real Effect Shows Up in Thin-Margin Leverage
So is the bright picture a lie? Not quite. The effect lands on operating profit, not sales.
Supermarkets run on very thin operating margins of about 1–3%, and most costs outside of goods are fixed, like rent and labor.
So a small rise in sales drops almost entirely to profit.
For example, if a typical supermarket has a contribution margin of 22.5% (gross margin 26% − variable SG&A 3.5%) and an operating margin of 2.5%, then a 1% rise in net sales lifts operating profit by about 9% (contribution margin 22.5% ÷ operating margin 2.5% ≈ 9×).
Applying that 9× to the net-sales changes from the previous section, +1.7% / +2.8% / +4.4% are amplified to operating profit of +15% / +25% / +40%.
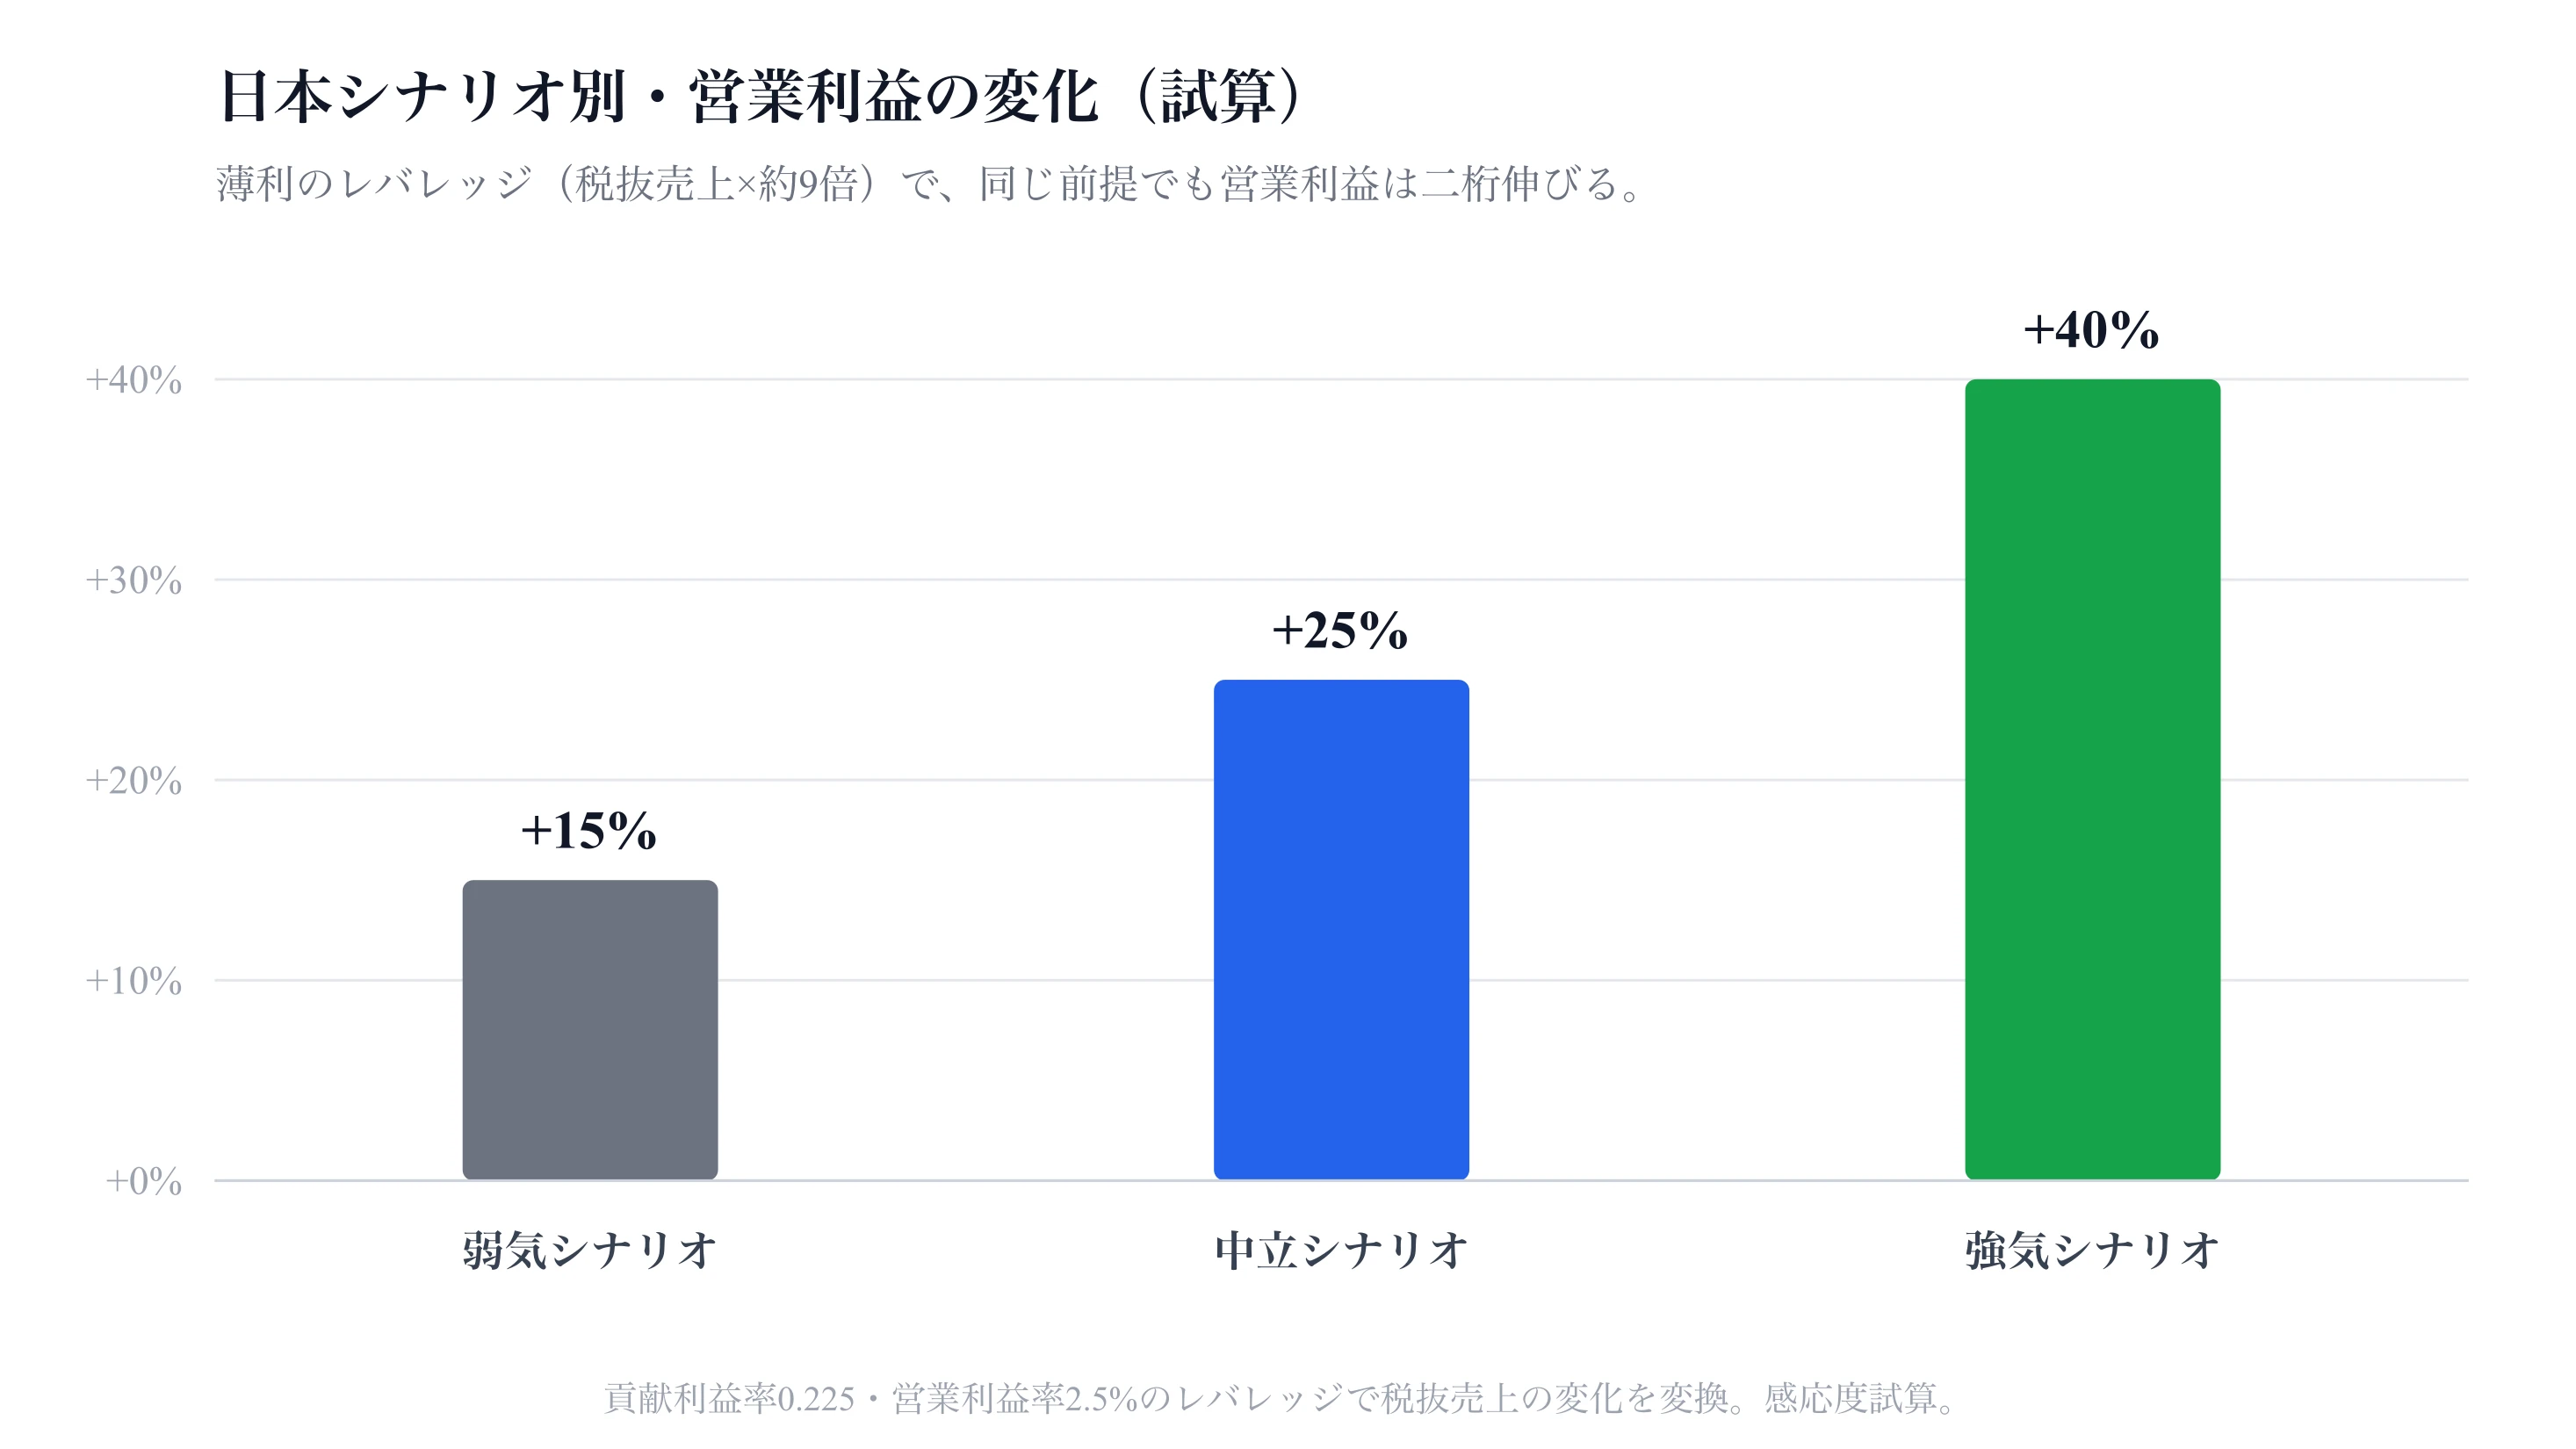
An estimate applying contribution-margin-0.225 / operating-margin-2.5% leverage to the change in net sales. It does not include the upside from retailers capturing part of the cut as margin when pass-through is incomplete (a further upside factor).
This leverage, naturally, bites harder the thinner the operating margin.
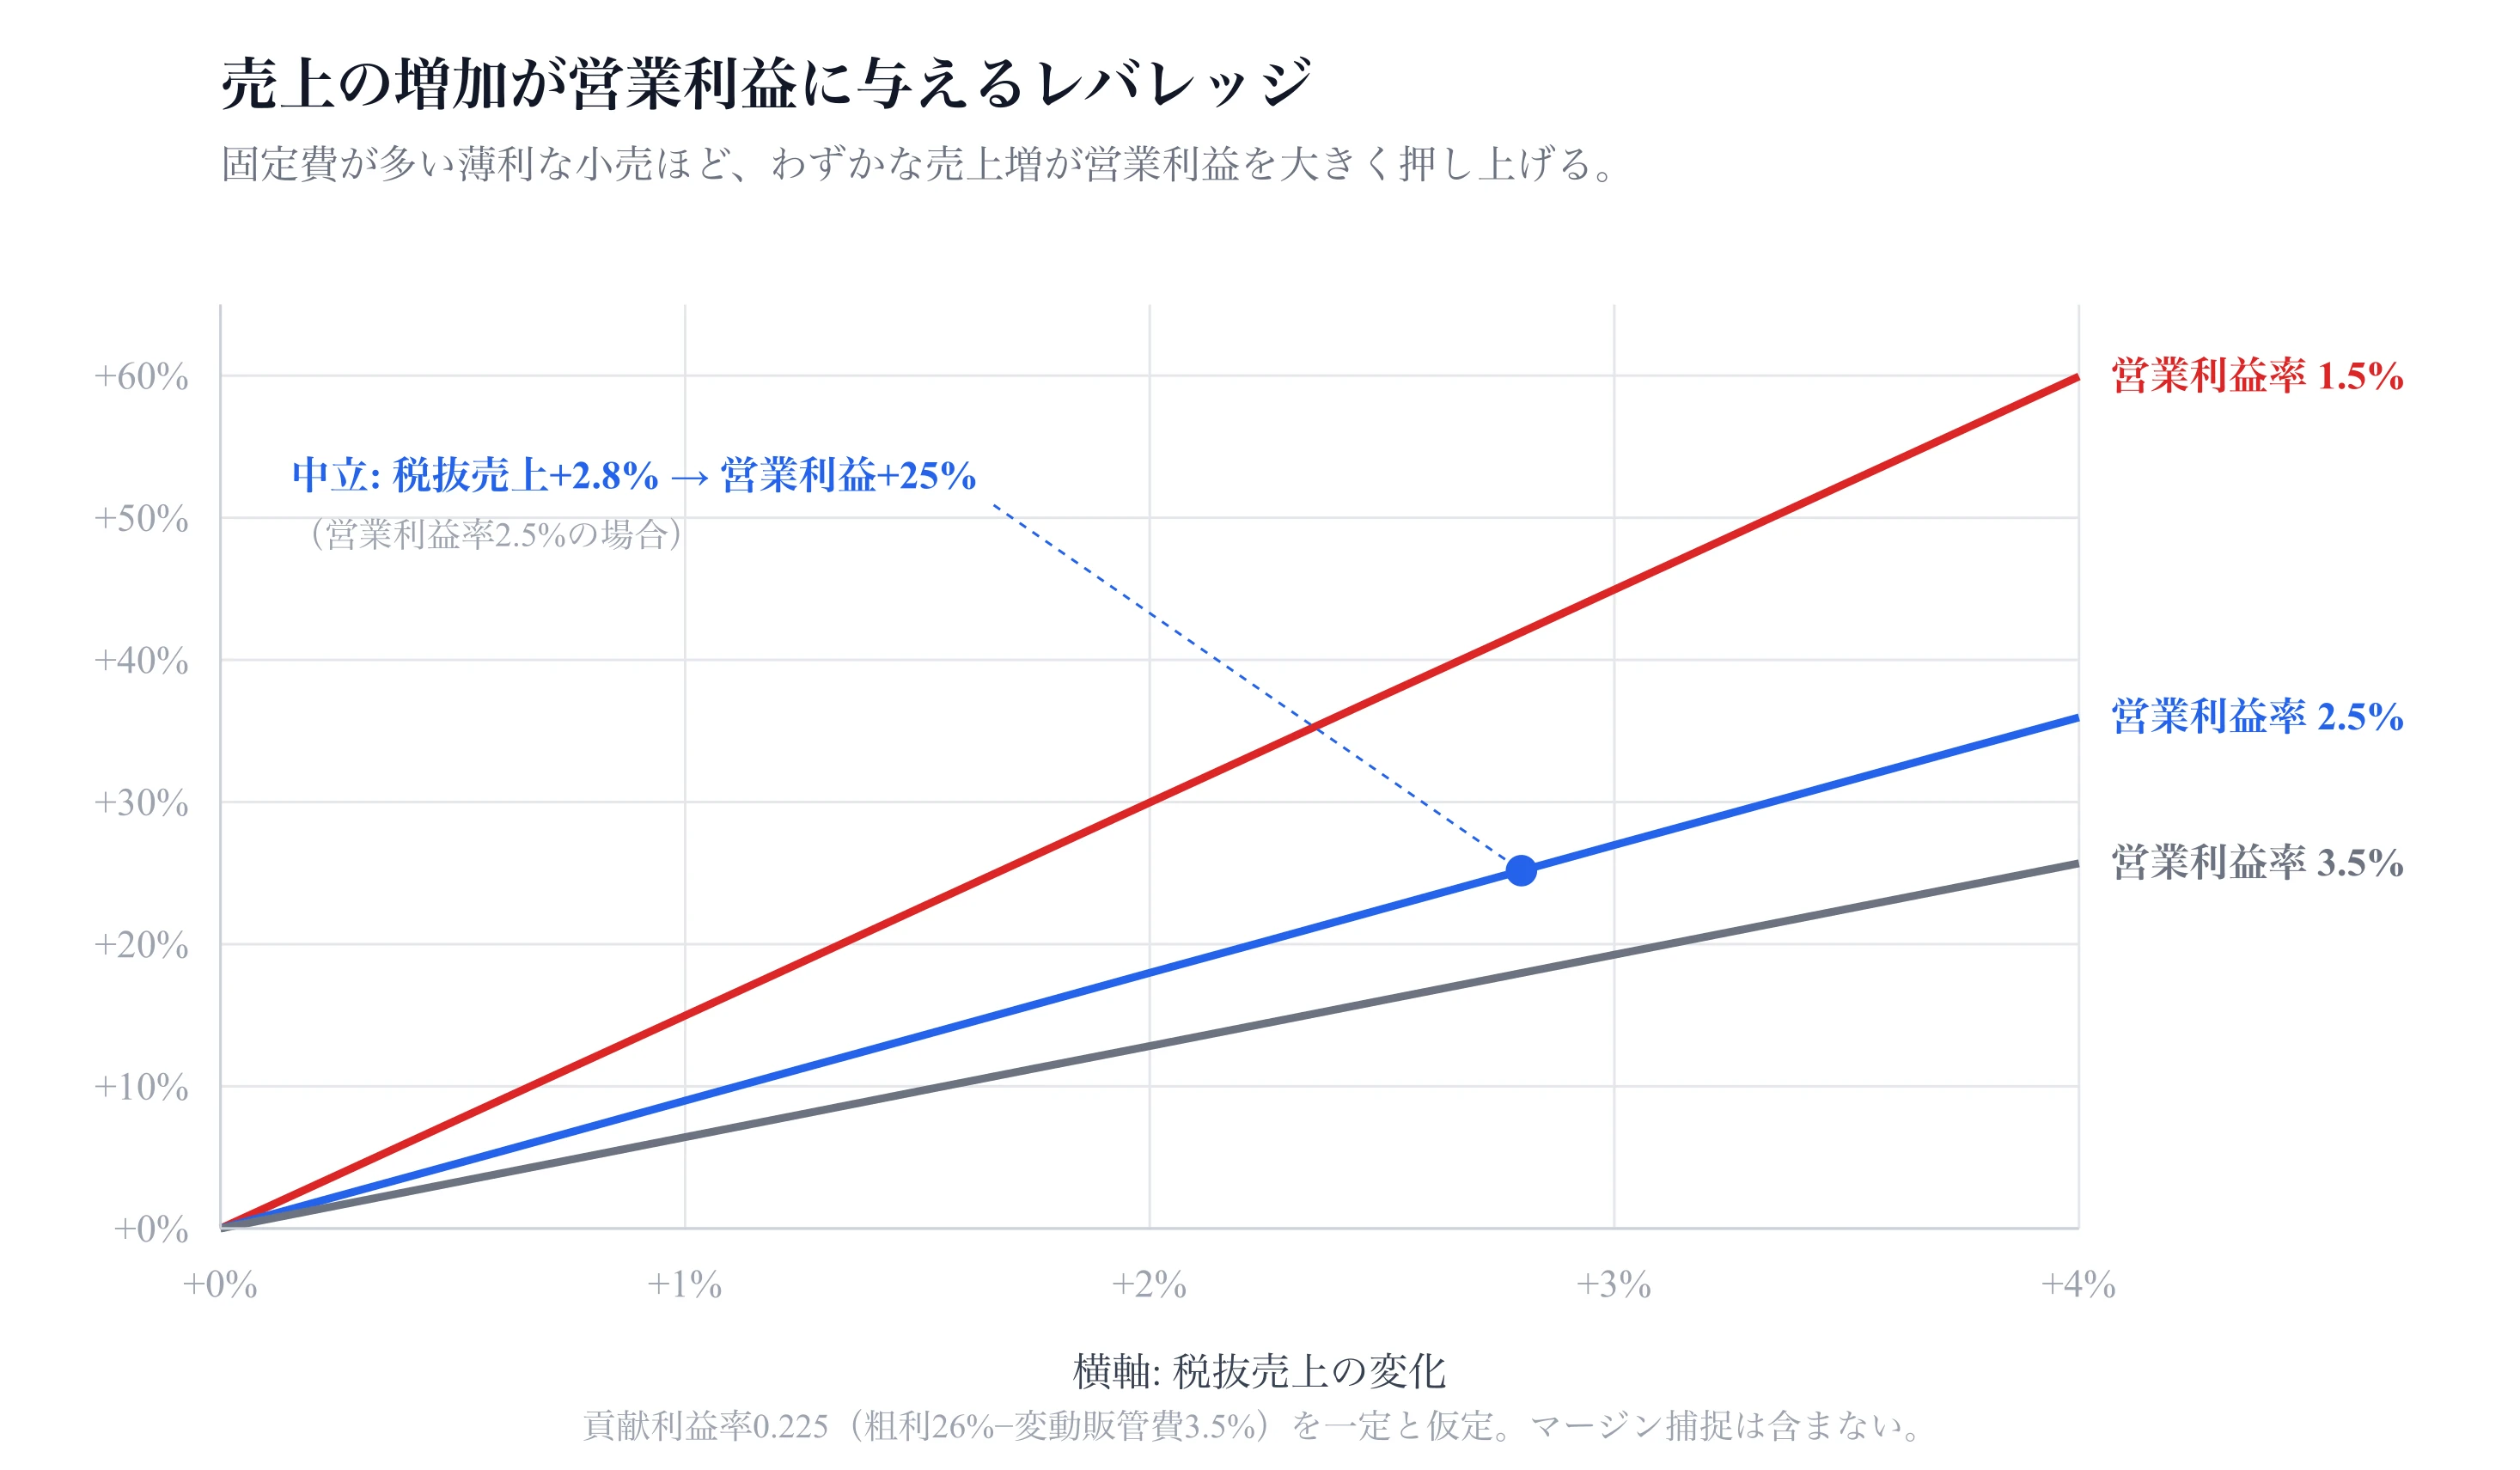
For the same +2.8% in net sales (base case), a store at 2.5% operating margin sees +25%, a thin 1.5% store more than +40%, and a 3.5% store +18% — the thinner the margin, the stronger the leverage.
In other words, it's not that customers and sales both jump a lot. The shape the data points to is "sales up a few percent, but profit up double digits, precisely because margins are thin."
There's downside living right alongside it, though. If it's temporary, the volume response is weak and a payback drop comes when it ends; freed-up money escapes into savings; population decline pushes volume down. Both the upside and the downside get amplified on top of this thin margin.
What Kind of Trade-Up Actually Happens
In the estimate, I assumed a "mix improvement" in which part of the freed-up income flows to higher value-added products. For the overseas cases too, you sometimes hear the hypothesis that after a cut, carbs go down while protein and deli items go up.
But I haven't been able to find public data that backs this up.
Most VAT-cut research centers on the pass-through rate and doesn't track how the contents of the shopping basket changed. Sweden only started in April 2026, and so far the downward price pressure seems concentrated in standard, easy-to-compare staples like milk, bread, and ground meat.
There is an economic regularity that the contents of food change as income rises.
On top of Engel's law (the food share of spending falls as income rises), there is Bennett's law. It's an observation, dating to 1941, that as income rises the share of cheap carbohydrates (staples) falls while the share of more expensive, more nutritious foods like meat and fish rises.
That said, Bennett's law holds clearly mainly in emerging economies and is known to be weak in already-affluent high-income countries. A recent analysis of Europe even reports the opposite — staple consumption rising as income rises — so in an already mature Japan, how much a ~6.5% cut flows into dietary upgrading may be limited.
How the Food Tax Cut Affects Online Grocery
I'm also curious about the effect on online grocery (grocery e-commerce). Here too, there's no direct data yet on changes in usage.
Still, there are a few clues on the price and institutional side.
One is a German e-commerce study showing pass-through differed by channel.
Multichannel retailers reflected the cut into prices almost completely, while online-only retailers barely cut prices.
Online grocery splits into two types: store-fulfilled, which inherits store prices, and centralized-warehouse (dark-store) fulfillment, run entirely separately from stores. Users of store-fulfilled online grocery are more likely to enjoy the price pass-through, while the benefit may be thin for users of warehouse-fulfilled services.
The other clue is the treatment of delivery fees. What gets cut is the food (the goods); delivery and service fees are often left at the standard rate. In Sweden too, delivery handled by a third party stays at 25%.
In Japan likewise, online grocery delivery fees are a service, not food, so they stay at 10% rather than the reduced 8% — the same structure.
Putting these together: for store-fulfilled online grocery the cut has about the same effect as for stores, while for warehouse-fulfilled online grocery it comes down to the operator's pass-through policy.
That said, these are inferences from price and institutional design; the actual usage data is still to come. If Sweden's food commission tracks the channel-level moves in particular, we'll get to check our answer.
The Middle Is Tough
Finally, the question of which of the many supermarkets the cut matters most for.
The benefit of the cut likely shows up asymmetrically depending on positioning.
| Positioning | Where it bites |
|---|---|
| Discount | Largest volume / customer-count gains from price-sensitive shoppers; enjoys the leverage |
| Strong PB / premium | Freed-up income flows to high value-added / private brands, lifting spend per customer and gross margin |
| Middle | Misses out on both volume and mix; smallest benefit |
As I showed in the previous article (The Middle Is Tough), the 12-month average of same-store sales was 103.7% for discount and 103.3% for premium, versus 101.2% for the middle. Even with the tailwind of a tax cut, if the sail that catches it is skewed to the two ends, the benefit too is likely to be thick at the ends and thin in the middle.
A tax cut looks like a policy that helps everyone equally, but in practice it may work to widen the gaps between positions. Behind the bright picture, the question "which store will we be chosen as?" feels, if anything, heavier.
References
- The Middle Is Tough (previous article)
- Statistics Bureau, Household Survey 2024 average (Engel coefficient 28.3%)
- Banco de Portugal: The Full, Persistent, and Symmetric Pass-Through of a Temporary VAT Cut (2025)
- Banco de España WP 2417: VAT cut pass-through in Spain
- Fuest, Neumeier & Stöhlker: Pass-through of temporary VAT rate cuts (ITPF 2023)
- Bachmann et al.: A Temporary VAT Cut as Unconventional Fiscal Policy (NBER 29442)
- Jaworski & Olipra: Cutting VAT on food in a high-inflation environment (Food Policy 2025)
- Sweden food VAT 12%→6% (Apr 2026 – end 2027)
- SCB: Food prices fell in April (Sweden, preliminary)
- INTAGE: Looking back at the 2014 consumption tax hike
- Bennett's law (income rise and the falling staple share)
- CBPP / FoodAPS: SNAP benefit increases, food spending, and diet quality
- Temporary VAT rate cuts and food prices in e-commerce (J. Retailing & Consumer Services 2024)


Comments
Share your thoughts or questions. Comments are published after approval.
Write a comment